Just RESTing: REST API Health Endpoints
... a universal REST starting point?
... a universal REST starting point?
Goal: We'll build a Python REST API endpoint, to provide information about our Linux server's health.

Overview When writing about improving a developer's REST experience, we tried to think about what endpoint examples would work across different types of companies and their REST API implementations. That is ... what sort of simple endpoint might apply to all REST APIs? This example could be used to introduce a new developer to your API, with the additional benefit that the example would apply to ANY API set. And a system health check seemed like a good starting point. What are Health Checks? First off, what is all of this about Health Endpoints and Health Checks? A health check is a way for developers consuming your API to make sure that your systems are running. There are a number of things that you can choose to report back to them; from a simple "system : isHealthy" to much deeper checks on your system's available diskspace; the status of interconnected micro-services and even if your database is writeable or not. Our Health Checks We will set up the structure for a 5 level deep health check. One endpoint (see figure c) will be able to check all 5 levels by altering the number parameter at the end of it. Access to each of these levels can be controlled through varying security checks, or even totally different endpoints for each level. For aneasyor geeky way to think of these levels, we will loosely base our health check on … the Star Trek Diagnostic Levels (shown below). In a nutshell, the Star Trek levels run from level 5 (a ~3 second, fully automated check) to level 1 (where you pull everything apart by hand, check it and put it back together. This can take hours or days). While our health checks will not require pulling things apart by hand, they will still be loosely based on the Star Trek flow. Checking level 5 returns a bit of starting info; like whether the API server is even accessible or not; and also the version of the API. Level 4 will dig a bit deeper and so on, until you get to level 1; which returns things like backend database status and the status of related micro-services. Level 1 will also return the results of all of the other levels. Doing this provides one, comprehensive health result, using just one api endpoint call.Of course, this is just one way of providing a health check. You can expose whatever health information that you desire; using however many levels that you desire. You can enable/disable different levels by requiring authorization in order to get to them.For an initial look at the data returned, calling the level 5 endpoint will provide the results shown in figure a. Although we will add various clients in future articles to call these endpoints; for now you can just click on the endpoint to run it in your browser. http://lavojo.org/api/health_levels/5
1 2 3 4 | {
"api_version": "3.0.3",
"is_connection_healthy": true
} |
figure a: A level 5 health check result
| Figure Color Legend | |
| Green | Levels, Properties |
| Orange | String values |
| Pink | Boolean values |
| Blue | Numeric values |
| White | Separators |
| code | actual code |
1 2 3 4 5 6 7 8 9 10 11 12 13 14 15 16 17 18 19 20 21 22 23 24 25 26 27 28 29 30 | {
"level_1": {
"db": {
"is_db_online": "True",
"is_db_writeable": true
},
"is_logging_enabled": true,
"storage": {
"free": "2T",
"held_back_by_system": "233G",
"percentage_available_free": 0.653,
"total": "5T",
"used": "3T"
}
},
"level_2": {
"%_ram_used":56.0,
"gb_ram_used":8.3877888
},
"level_3": {
"are_supporting_microservices_healthy": false
},
"level_4": {
"is_bandwidth_sufficient": false
},
"level_5": {
"api_version": "3.0.3",
"is_connection_healthy": true
}
} |
figure b: A level 1 health check result
The End Point (EP)
Our level 1 EP http://lavojo.org:5000/api/health_levels/1 breaks down like this:
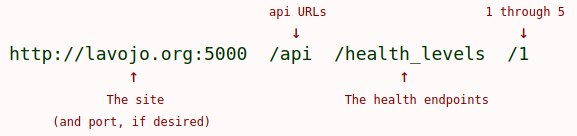
figure c: Level 1 health check endpoint
It starts with your base URL http://lavojo.org. You can configure a specific port if desired, but you do not have to do so.
This is followed with /api; which is a bit of a standard way to group REST "api" URLs together; but again you can choose whatever that you would like to here – including nothing at all.
Then is our moniker for our health endpoints, /health_levels. As above, you can use whatever text that you like here, but for us it is a way of grouping the "level" endpoints. In some systems this would also return information if called alone, like this ... http://lavojo.org:5000/api/health_levels/. This could return summary information about how the levels work; or even just return all of the level results, exactly like our /1 endpoint will do. It is up to you.
Finally, comes the URL reference to the endpoint itself.
http://lavojo.org:5000/api/health_levels/1 for level 1, through
http://lavojo.org:5000/api/health_levels/5 for level 5.
These endpoints expect an integer value from 1 to 5 and will return a "HTTP 404 Not Found" error if other numbers or alphanumeric characters are used.
The Results
There are essentially two main chunks in the level 1 results shown in figure b.
The first is that all of the lesser levels (5 through 2) are checked and presented as well.
For our system, these run:
• level 5 – the API version and that you can connect at all,
• level 4 – bandwidth to the server,
• level 3 – are the supporting microservices running (healthy)?,
• level 2 – the amount of available server RAM
Secondly, level 1 adds checks to see if the database is online and writeable; if backend logging is enabled, and shows various stats on the available diskspace.
The shaded lines 4-5 just show how a boolean True is represented as a string or as a json boolean true value. The following code section shows how to return it each way.
The shaded line 10 item "held_back_by_system" is primarily a Linux thing. Linux file systems like EXT4 reserve space for the administrator to use when there are problems. The default amount kept back is 5%, which adds up to some serious space being generally unavailable on larger disk drives. In our case above, it is 233GB.
As an aside -- we struggled with the levels running in the Star Trek fashion, from 5 (least work) to 1 (most work).
It seems to make more sense to run the other way around (1:least to 5:most).
Buuut... who are we to argue with Roddenberry? For this example we'll stick with the Trekkie approach, as many are familiar with it.
Of course, feel free to swap these around as you see fit.
And finally HOW (to get these Results)
Saving the best part for last, is how to do all of this.
The first version of this will be a standard Python Flask application running on (Debian) Linux, without OpenAPI/Swagger bells and whistles (but we'll add those later on too).
If you are not familiar with Flask, it is a very simple way to use Python to create web applications (including REST API implementations). See here for more about Flask itself.
Our REST implementation will return a JSON formatted result, as in figure b.
Some customers/users may require a XML result instead. Your system can do this by changing the http request, by having multiple endpoints, or just by returning XML instead of JSON. We will show the common JSON approach in this example.
We will focus on the endpoint's code itself in figure d. For installing and using flask see the Flask site. For existing flask sites, implementing this endpoint (with your modifications, of course) is as simple as copying the app routes and functions into your route file. Make sure to include the top imports if you do not already use them. If you would like to test this code in a stand-alone server, see the sidebar How to Test.
1 2 3 4 5 6 7 8 9 10 | #!/usr/bin/env python3 import json import math import os import psutil import shutil from flask import Flask, request, jsonify app = Flask(__name__) API_VERSION = "Not found" try: API_VERSION = os.environ['API_VERSION'] except Exception as e: print("Err 100, server: ",e) # 3 stub routines def is_db_online(): return "True" def is_db_writeable(): return True def is_logging_enabled(): return True def bytes2human(n): symbols = ('K', 'M', 'G', 'T', 'P', 'E', 'Z', 'Y') prefix = {} for i, s in enumerate(symbols): prefix[s] = 1 << (i+1)*10 # creates: prefix = {'K': 1024, 'M': 1048576, 'G': ... for s in reversed(symbols): if n >= prefix[s]: value = float(n) / prefix[s] return str(math.ceil(value)) + s return "%sB" % n def check_level(level=5): if level == 5: return { "api_version" : API_VERSION, "is_connection_healthy" : True } if level == 4: return { "is_bandwidth_sufficient" : False } if level == 3: pass # this calls the health apis of internal microservices. return { "are_supporting_microservices_healthy" : False } if level == 2: return { "gb_ram_used" : psutil.virtual_memory()[3]/1000000000, "%_ram_used" : psutil.virtual_memory()[2] } @app.errorhandler(404) def invalid_route(e): return e @app.route('/api/health_levels/<int:level>', methods=['GET']) def health_levels(level = 5): if level > 1 and level <= 5: return check_level(level) if level == 1: # The most extensive health check. # 1 will include the 5 through 2 checks, as well rslt={} total, used, free = shutil.disk_usage(__file__) rslt["level_5"] = jsonify(check_level(5)) rslt["level_4"] = jsonify(check_level(4)) rslt["level_3"] = jsonify(check_level(3)) rslt["level_2"] = jsonify(check_level(2)) rslt["level_1"] = {} rslt["level_1"]["storage"] = {} rslt["level_1"]["storage"]["total"] = bytes2human(total) rslt["level_1"]["storage"]["used"] = bytes2human(used) rslt["level_1"]["storage"]["free"] = bytes2human(free) rslt["level_1"]["storage"]["held_back_by_system"] = bytes2human(total - used - free) rslt["level_1"]["storage"]["percentage_available_free"] = round(1 - free / total,3) rslt["level_1"]["db"]= {} rslt["level_1"]["db"]["is_db_online"] = is_db_online() rslt["level_1"]["db"]["is_db_writeable"] = is_db_writeable() # There could be a lot more here, like: # does the requesting user have DB access?, etc. rslt["level_1"]["is_logging_enabled"] = is_logging_enabled() return jsonify(rslt) else: # outside of the range of 5-1 return jsonify({"code":404,"message":"HTTP 404 Not Found"}) return jsonify({'level': str(level)}) if __name__ == '__main__': app.run(debug=True, port='5000') |
figure d – the code listing of health.py
Pointing out some of the pieces:
The core pieces are these lines:
@app.route('/api/health_levels/', methods=['GET'])
def health_levels(level = 5):
This route and associated function are called when you enter the endpoint http://lavojo.org/api/health_levels/1, with any integer at the end. /5 through /1 will be processed, while any other number will result in a 404 Not Found error. The METHOD='GET' establishes this as a GET endpoint and that no data is expected to be sent to the server (other than the 5 through 1).
If the level being checked is 2 through 5, it will be handed off to check_level() to be dealt with separately. Otherwise, a level_1 is processed; which will first do levels 5 through 2 as well. Again, this is just so that level_1 can be counted on to check everything. All of the result data is grouped together into a dictionary ( {} ) and the results are returned to the caller as JSON.
You will notice that the Python boolean values of True and False are correctly returned in the JSON result (figure b) as true and false. In the same way, a Python value of None is correctly returned as JSON's null.
Changes that you will want to make include:
1, Exporting two environment variables.
They are the API version (line 14 is where this value is loaded from the environment) and most likely, another for the actual drive to check.
These can be hard-coded; but it is nice to be able to change these without having to alter the code itself. To add one of these to your environment, before you start your test, type $ export API_VERSION="1.0" and then $ env to see all active environment variables; which should now include "API_VERSION".
If you want to put this export somewhere where it will be set up every time that you test, edit your ~/.bashrc file and add the line there. The .bashrc file is processed every time that you open a terminal. Type $ source .bashrc or $ . .bashrc to execute .bashrc, or simply open a new terminal to do so.
If you want to put it somewhere that all users (including your production flask code) can see it, consider adding the export(s) to your "/etc/environment" file. Edit this file as a sudo (admin) user, as this file is owned by root.
2. __file__ (line 74) contains the path and filename of the currently executing python/flask program, or 'health.py' in our case. This will be your routes file if you moved this code there or 'health.py' if you are using our How to Test sidebar. The location of __file__ is used to determine where to check the disk space.
You can use actual disk labels instead of __file__. For your own drive label names, see $ df -h or your $ ls /media/ folder for a list of your available extra storage drives.Caution: Device & partion names, like /dev/sdc or /dev/sdc1 do not return reliable results. Stick with a physical file location or drive labels. If you would like to add or change a drive label on an attached NTFS drive, see how to label NTFS drives. 3. Our page/url not found error handler...
@app.errorhandler(404)
def invalid_route(e):
return e
...returns a very stock 404 error.
You can choose to spice this up by returning a full html page (see Flask, Templates) or a HTML string. For example, this:
return "<br><br><br><div style='text-align:center;color:#800000;width:60%;margin:0 auto; padding:25px;font-family:sans-serif;'><br><center><img src='404.png' height='50'></center><br>requested URL:<span style='color:#000000;font-size:small;'>" + request.url + "<span><br><br>" + str(e) + "</div>" ... returns this:
requested URL: https://lavojo.org/api/health_levels/999
404 Not Found: The requested URL was not found on the server. If you entered the URL manually please check your spelling and try again.
figure e – Improved Not Found message.
4.app.run(debug=True, port='5000')This line is used to start Flask and assign port 5000 to the application. In production you probably will not want to use a port other than the standard http (80) or https (443) ports, which do not need to be set in this line of code at all. However, you definitely do not want to run a production app in debug mode; as debug provides a great deal of information that should not be shown to your production users. This includes the names of source files and actual lines of any errors. Set debug=True only when testing.On the client side, the call to a health check endpoint should be timed (by including a wrapper around it that times out after, say 10-30 seconds), so you will not be tied up waiting if the API service is actually down. How to do so will be covered in the Clients article.Star Trek Diagnostic Levels 3.13 SYSTEM DIAGNOSTICS All key operating systems and subsystems aboard the Enterprise have a number of preprogrammed diagnostic software and procedures for use when actual or potential malfunctions are experienced. These various diagnostic protocols are generally classified into five different levels, each offering a different degree of crew verification of automated tests. Which type of diagnostic is used in a given situation will generally depend upon the criticality of a situation, and upon the amount of time available for the test procedures.Level 1 Diagnostic. This refers to the most comprehensive type of system diagnostic, which is normally conducted on ship's systems. Extensive automated diagnostic routines are performed, but a Level 1 diagnostic requires a team of crew members to physically verify operation of system mechanisms and to system readings, rather than depending on the automated programs, thereby guarding against possible malfunctions in self-testing hardware and software. Level 1 diagnostics on major systems can take several hours, and in many cases the subject system must be taken off-line for all tests to be performed. Level 2 Diagnostic. This refers to a comprehensive system diagnostic protocol which, like a Level 1, involves extensive automated routines, but requires crew verification of fewer operational elements. This yields a somewhat less reliable system analysis, but is a procedure that can be conducted in less than half the time of the more complex tests. Level 3 Diagnostic. This protocol is similar to Level 1 and 2 diagnostics but involves crew verification of only key mechanics and systems readings. Level 3 diagnostics are intended to be performed in ten minutes or less. Level 4 Diagnostic. This automated procedure is intended for use whenever trouble is suspected with a given system. This protocol is similar to Level 5, but involves more sophisticated batteries of automated diagnostics. For most systems, Level 4 diagnostics can be performed in under 30 seconds. Level 5 Diagnostic. This automated procedure is intended for routine use to verify system performance. Level 5 diagnostics, which usually require less than 2.5 seconds, are typically performed on most systems on at least a daily basis, and are also performed during crisis situations when time and system resources are carefully managed. STAR TREK: THE NEXT GENERATION TECHNICAL MANUAL